● A FRESH PERSPECTIVE ON MALTA’S OFFICE MARKET
A shortlist with the numbers behind it

More office for your budget.

Source-listed rentals with a comparable asking rate at least 20% below their zone sample mean. Lowest monthly asking rents appear first.

Collection checked 13 Nov 2026 · 90 qualifying options · 9 locality/type groups assessed · See the calculation ↓

Cite this market snapshot

Office Malta · OfficeSpace.Rent collection checked · methodology 2026-11-03.7. Sliema sample median €250 per m² per year from 25 selected asking quotations. Serviced packages use monthly asking cost per advertised desk. Zone figures are published from 15 eligible quotations. Figures describe advertised asking rents in this collection. Combined zones cover multiple locality labels.

Zone index and sample definitions · Download the source ledger

Reset

5 matching options. Showing 1–5. Conventional offices use annual rent per m²; serviced suites use monthly price per supplier-advertised desk. These units are never mixed.

27.1% below zone sample mean
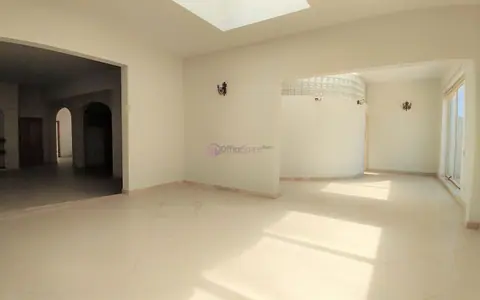
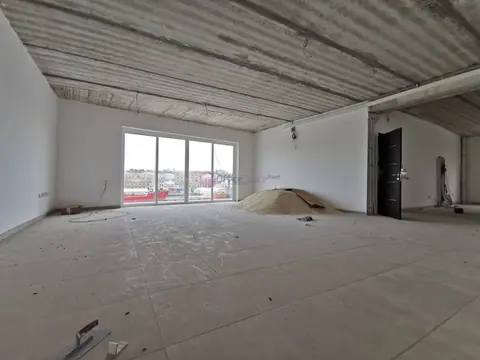
Zabbar private office to rent, 215 m² — reference 45494, photograph 1Listed availablePrivate office
⌖ Zabbar

215 m² Penthouse Office to Rent in Zabbar · Ref 45494

▧ 215 m²Ref. 45494To rent
€2,300 / month↗

Why this listing qualifies

This office’s rate
€128.37 / m² / year
Qualifying ceiling · 80% of mean
€140.88 / m² / year
Comparable sample
20 selected quotations, including this office
View benchmark range & formula

Observed asking-rate range: €118.42 / m² / year–€290.32 / m² / year. Median: €171.82 / m² / year.

(€176.1 − €128.37) ÷ €176.1 × 100 = 27.10% below mean. Displayed money is rounded; qualification uses unrounded rates.

31.8% below zone sample mean
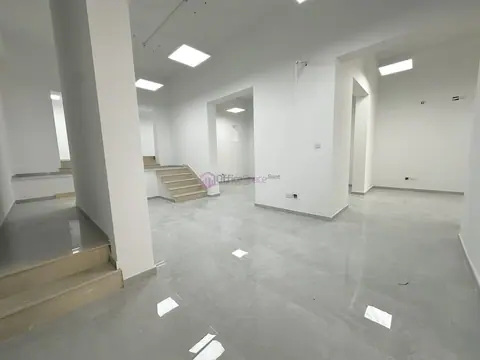
Fgura private office to rent, 250 m² — reference 59018, photograph 1Listed availablePrivate office
⌖ Fgura

250 m² Office to Rent in Fgura · Ref 59018

▧ 250 m²Ref. 59018To rent
€2,500 / month↗

Why this listing qualifies

This office’s rate
€120 / m² / year
Qualifying ceiling · 80% of mean
€140.88 / m² / year
Comparable sample
20 selected quotations, including this office
View benchmark range & formula

Observed asking-rate range: €118.42 / m² / year–€290.32 / m² / year. Median: €171.82 / m² / year.

(€176.1 − €120) ÷ €176.1 × 100 = 31.86% below mean. Displayed money is rounded; qualification uses unrounded rates.

32.7% below zone sample mean
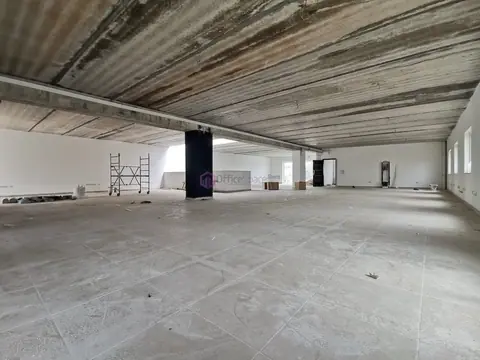
Marsa private office to rent, 380 m² — reference 20966, photograph 1Listed availablePrivate office
⌖ Marsa

380 m² Office to Rent in Marsa · Ref 20966

▧ 380 m²Ref. 20966To rent
€3,750 / month↗

Why this listing qualifies

This office’s rate
€118.42 / m² / year
Qualifying ceiling · 80% of mean
€140.88 / m² / year
Comparable sample
20 selected quotations, including this office
View benchmark range & formula

Observed asking-rate range: €118.42 / m² / year–€290.32 / m² / year. Median: €171.82 / m² / year.

(€176.1 − €118.42) ÷ €176.1 × 100 = 32.75% below mean. Displayed money is rounded; qualification uses unrounded rates.

26.4% below zone sample mean
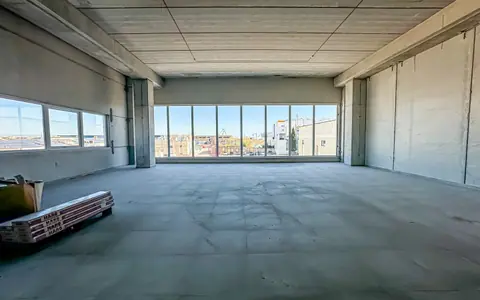
Paola private office to rent, 500 m² — reference 60699, photograph 1Listed availablePrivate office
⌖ Paola

500 m² Office to Rent in Paola · Ref 60699

▧ 500 m²Ref. 60699To rent
€5,400 / month↗

Why this listing qualifies

This office’s rate
€129.6 / m² / year
Qualifying ceiling · 80% of mean
€140.88 / m² / year
Comparable sample
20 selected quotations, including this office
View benchmark range & formula

Observed asking-rate range: €118.42 / m² / year–€290.32 / m² / year. Median: €171.82 / m² / year.

(€176.1 − €129.6) ÷ €176.1 × 100 = 26.41% below mean. Displayed money is rounded; qualification uses unrounded rates.

26.9% below zone sample mean
Marsa private office to rent, 700 m² — reference 20994, photograph 1Listed availablePrivate office
⌖ Marsa

700 m² Office to Rent in Marsa · Ref 20994

▧ 700 m²Ref. 20994To rent
€7,500 / month↗

Why this listing qualifies

This office’s rate
€128.57 / m² / year
Qualifying ceiling · 80% of mean
€140.88 / m² / year
Comparable sample
20 selected quotations, including this office
View benchmark range & formula

Observed asking-rate range: €118.42 / m² / year–€290.32 / m² / year. Median: €171.82 / m² / year.

(€176.1 − €128.57) ÷ €176.1 × 100 = 26.99% below mean. Displayed money is rounded; qualification uses unrounded rates.

How we identify these options

  1. Use the current source-listed rental collection. Sales and listings marked unavailable are excluded. Supplier titles and descriptions identifying non-office or mixed uses, source-reference conflicts and conflicting facts are excluded pending review. Inclusive/shared packages are separated using description evidence as well as titles. Each property reference counts once.
  2. Put prices on a comparable basis. Conventional rate = monthly asking rent × 12 ÷ advertised m². Serviced rate = monthly asking price ÷ supplier-advertised desks. Area-derived people estimates are never used as desk counts.
  3. Group by locality and office type. Allocate each quotation to one canonical zone and keep office types separate. Ambiguous cross-zone labels are withheld. A zone can combine nearby villages; it is not a village-specific valuation.
  4. Select 15–25 comparable quotations. Conventional units must be at least 50 m². Deduplicate references and likely repeated quotations; sort by area then source URL and select up to 25 evenly spaced records. Below 15, withhold the benchmark. The subject is included only if selected. Only the active OfficeSpace.Rent source collection is used. Competitor quotations are excluded.
  5. Calculate the arithmetic mean. Add individual comparable rates and divide by the number of listings. Every listing has equal weight; this is not area-weighted, desk-weighted or the median.
  6. Apply the 20% test. A listing qualifies when its unrounded rate is no more than 0.80 × the group mean. Percentage below mean = (mean − property rate) ÷ mean × 100. Exactly 20% below qualifies.
  7. Rank for affordability. Default order is monthly asking rent, lowest first; ties use the larger relative discount, then property reference. You can instead sort by the largest percentage below mean.

A worked example

If a 15-office sample contains five rates each at €160, €200 and €240 per m²/year, its mean is (5 × €160 + 5 × €200 + 5 × €240) ÷ 15 = €200 per m²/year. The qualifying ceiling is €200 × 0.80 = €160. The €160 listing is exactly 20% below the mean and qualifies. The example is illustrative, not a live property quote.

Inspect every source behind the benchmark

The Village Rent Index is the central source of all comparison figures. It lists every included and excluded property, source URL, asking price, area or desk count, and exclusion reason.

What the screen can and cannot tell you

This is a mathematical screen of advertised asking rates from OfficeSpace.Rent’s active available collection only. The full observed range and median are shown for context. No outliers are silently removed; a high asking rate can pull the mean upward. Small samples and overlapping unit configurations can affect the result.

Condition, fit-out, included services, external-area treatment, lease length, future start dates, VAT, parking and fees can differ. A low unit rate does not guarantee a low total bill or suitability. Read the availability badge, confirm the current quote and compare the complete package before deciding. This is not a valuation, negotiated saving or claim that a property is objectively underpriced.

In this snapshot, 130 non-office, ambiguous mixed-use or source-conflict rental entries are excluded; 47 rental listings lack the required positive facts or locality; 57 further listings belong to groups containing fewer than 15 eligible quotations and are not assessed. The same index sample powers these results. Daily inventory changes recalculate eligibility; the rent index, locality pages and Best Value use the same OfficeSpace.Rent-only source snapshot.

Full source methodology · Download the workings as JSON · Build a complete office budget